Module 12 Assignment: Visual Social Network
For this assignment, I once more opted to use RStudio, as it's what I more used to when it comes to creating visual representations of data.
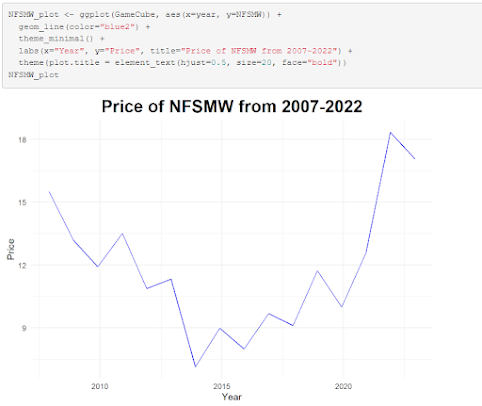
To get started, I opted to try out the example code left on the assignment page to get a sense of how RStudio handles projects like this.


Once it was made more clear how to make such visual plots, I aimed to experiment with a template dataset and see what I could make.


While it was certainly a fun visual exercise, there's still a lot I want to try to research regarding how analysis plots like this can be made, including how to add more details that can be shown through varying visual devices, like colors and different shapes for each node, as well as better labeling for the legend.


Comments
Post a Comment