LIS 4317 Final Project: R Chart showing Game Price changes over time
For this final project, I remembered the concept of used game prices tending to increase over time, especially older ones (more than 15 years old or so). With the lack on any decent visually-based references to measure the change in time these prices have had, I took it upon myself to make my own.
Since no database I could find contained price listings, I obtained my own using PriceCharting.com. I selected a few random games released for the Nintendo GameCube, and recorded the price listing for "loose" games (only the disc). I then compiled all of the prices into an Excel CSV and imported it into RStudio.
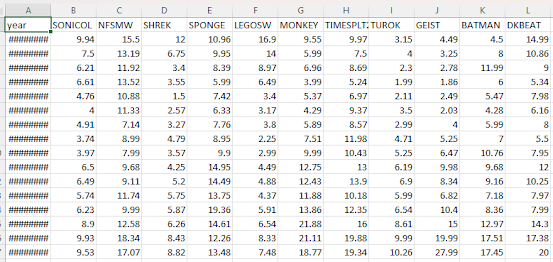
For clarification, the games I chose were (from left to right):
- Sonic Classics Collection
- Need For Speed: Most Wanted
- Shrek: Extra Large
- SpongeBob Squarepants: Battle For Bikini Bottom
- Lego Star Wars: The Video Game
- Super Monkey Ball
- TimeSplitters 2
- Turok: Evolution
- Geist
- Batman: Dark Tomorrow
- Donkey Kong Jungle Beat
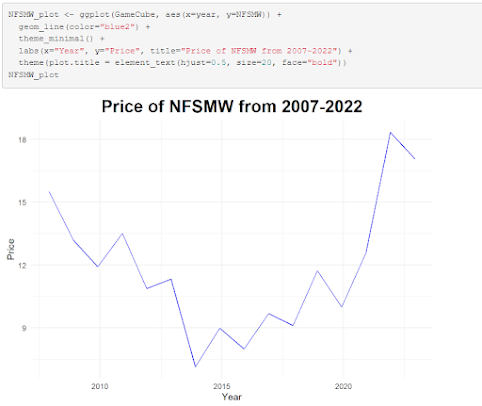
I then made a ggplot function that would allow me to easily create visualizations for whichever game I wanted to look at. In terms of visualizations in R, I've found ggplot2 to be the most reliable and easiest to use, and offers the most customizability in return. Additionally, being able to make the graphing function callable with just the game name allowed for both easier visualization as well as the ability to more easily add new data to the graph to visualize.


Already the benefits of visualizing this data are proving to be useful; it's much clearer to see how varied the price becomes over time. However, this isn't a proper visualization of all of the data. This was the last thing I worked on: it includes lines for all of the games as well as an average trendline, incorporating the mean price of all of the games per year to show the average change in price over time.


Examining this, it's made clear that the rate of change in terms of game price is steadily moving upwards over time, which we can use to theorize on potential future game prices (NFSMW in particular looks like it'll see quite the price hikes in the years to come!). Overall, I had a lot of fun delving into some games for the past I have some fond memories of, and being able to see where they'll go thanks to visualizing with R is beyond a treat.


Comments
Post a Comment