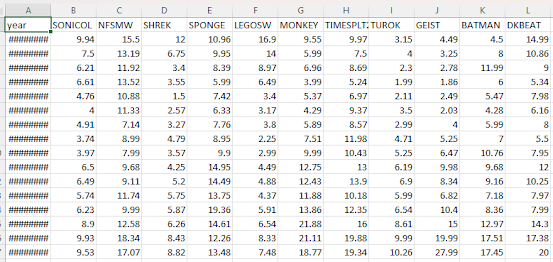
Module 3 Assignment: Data Frame Funsies.
Using the data provided to make this data frame, we can see that Donald Trump received the most poll numbers from both ABC and CBS, with Carly making the least number in the election. This data frame could be presented in a more visually appealing method, however, such as being used in a bar graph, as shown here:
GitHub link: https://github.com/Retrolovania/R_Programming/blob/main/Module%203.R


Comments
Post a Comment