Final Project: Price Changes over Time
The main goal of this project was to observe price changes of certain videogame titles released for the Nintendo GameCube starting from 2007 and up to 2022, and try to predict how pricing trends will continue through the future. To start off, I first made a list of eleven games to study closely, which in the order examined are:
- Sonic Mega Collection
- Need for Speed: Most Wanted
- Shrek: Extra Large
- SpongeBob SquarePants: Battle for Bikini Bottom
- LEGO Star Wars: The Video Game
- Super Monkey Ball
- TimeSplitters 2
- Turok Evolution
- Geist
- Batman: Dark Tomorrow
- Donkey Kong Jungle Beat
Then, I used a price-recording website known as PriceCharting in order to get the average value of loose copies of each of these games for every year starting from 2007 and ending at 2022. Each price was picked from every December of each year.
Here are the results I gathered in the CSV file used for the coding portion of this project:

Originally, I had designed a separate ggplot function for every game I wanted to examine. While it worked fine for practical purposes, it made the resulting code quite dense and long. After some research, I was able to rewrite the code so that the ggplot itself works as a function, and each game can be assigned to it with a variable. Here is the code that does this:
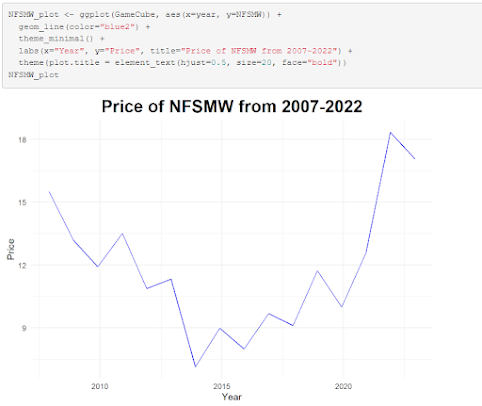
Once the data was collected, it was time to code. I used the ggplot2 library to construct time plots for each game's prices over time mainly for its easy-to-understand layout and easy visual customization tricks.

With this code, I was more efficiently able to create some of the graphs shown below, offering a more visual representation of my findings.


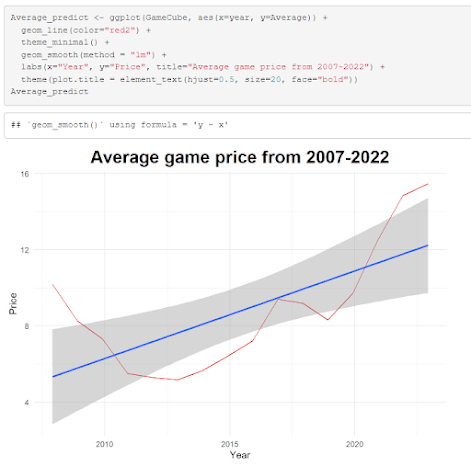
You may have noticed a pattern with these graphs, and the others also showcase this; the prices start off sharply dropping down, lingering in the lower price range for some years, then begin to gradually go back up around 2019-2020. Would this imply that game prices for GameCube may continue to go up in the near future? In order to determine this, I needed to calculate the average values for all the games in each year, which I achieved using a combination of rowMeans() and my plotting function.

Once I wound up with this average-valued plot, I then made a new plot function that incorporated an extra line of code to create a trendline, which gives more insight in the potential direction for the price over time.


Comments
Post a Comment